
Application development

How to Easily Load Test Serverless Apps With Postman and AWS
When you mention load testing to a software engineer, nine times out of 10 you see a slight wince in their face. Why? Because historically, load tests have been painful.
Building automated test scripts is tedious, developers didn’t think about performance at scale during the initial build, and nobody knows how to address the issues that crop up as a result.
Sounds like a recipe for disaster. Necessary disaster, but a mess nonetheless.
 Photo by Matthew Henry on Unsplash
Enter serverless. If you’ve built your app using FaaS (Functions as a Service), you’re in luck. You likely already know about the numerous benefits of AWS Lambda, but you can add easy to load test on there now too.
A core tenet behind serverless apps is to be API first, which means you are able to fully exercise the system via endpoints. All you need in order to load test is just a way to chain these requests together to build your test scripts.
Once you have your test scripts, you need a tool that can run them at scale. Our good friends at AWS have provided us with a tool that does just that.
Lastly, you need to be able to monitor the system health while the load test is running. Guess what? AWS has us covered on that too.
Use Postman to Build Your Test Scripts
 Photo by Science in HD on Unsplash
Postman is going to act as your script builder. You should have a set of business processes that you want to see perform under load, and Postman is going to help orchestrate that.
If you already use Postman and have collections built that run through business processes — great! You can use those without any additional setup. If you do not, I would highly recommend using the Postman Interceptor and walking through some of the business processes.
The interceptor will record all the requests made through your browser, leaving you with a collection that does exactly what your application does. All you have to do afterward is parameterize the requests (if necessary) so they can properly chain together for multiple runs.
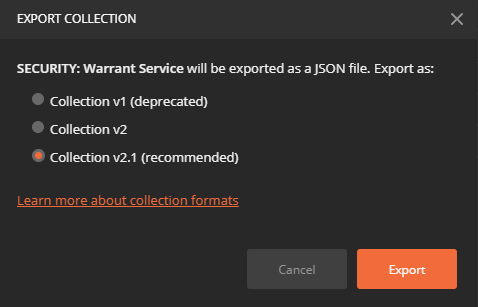
When you have your collection configured to your liking, export it to JSON as a collection v2.1.
Configuring the Load Testing Tool
We are going to be using the load testing mechanism created by AWS. Out of the box, it does not support Postman collections, but we can quickly modify it to run out collections via Postman’s CLI — Newman.
Follow the deployment instructions on the webpage to deploy the stack of load testing resources into your AWS account. While the stack is deploying, we can take on the code changes needed to support Postman.
Clone the GitHub repository for the AWS load testing tool and navigate to the .\source\container folder. Next, do the following steps:
- Take the exported Postman collection JSON and add it to the folder.
- Add a new file called
test.jsonwith the following contents:
{
    "execution": [
        {
            "executor": "newman",
            "iterations": 5000,
            "scenario": "simple"
        }
    ],
    "scenarios": {
        "simple": {
            "script": "Collection.json",
            "timeout": "5s",
            "think-time": "1s"
        }
    },
   "reporting":[
      {
         "module":"final-stats",
         "summary":true,
         "percentiles":true,
         "summary-labels":true,
         "test-duration":true,
         "dump-xml":"/tmp/artifacts/results.xml"
      }
   ]
}
You can change the value in iterations on line 5 to however many times you want your collection to run.
The script value on line 11 is going to be the name of your exported collection from Postman.
3. Update Dockerfile to include the new JSON files
FROM blazemeter/taurus
# taurus includes python and pip
RUN pip install --no-cache-dir awscli
# Taurus working directory  = /bzt-configs
ADD ./load-test.sh /bzt-configs/

# Added json files for Postman support
ADD Collection.json .
ADD test.json .

RUN chmod 755 /bzt-configs/load-test.sh
ENTRYPOINT ["sh", "-c","./load-test.sh"]
At this point, we are done editing the source. Now we need to push our changes into ECS.
Updating the Load Tests in AWS
By now, the stack we deployed into AWS should have finished. We can now go into the ECS service and navigate to the Amazon ECR Repositories link on the lefthand side of the page.
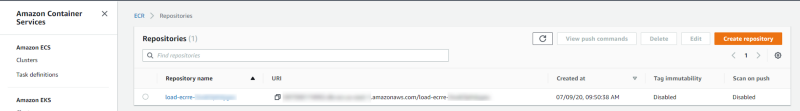
Select the load testing repository in your list to bring up the list of images.
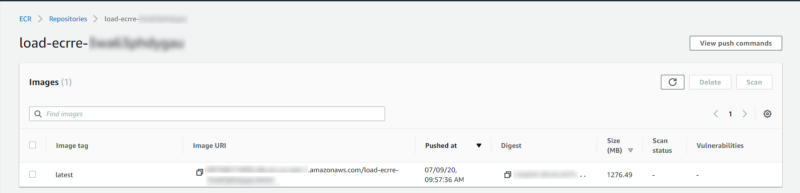
From here, you want to click on the View push commands button in the upper right to get a set of commands specific to your repository. There are four commands given to update the repository with our changes.
On your local machine, open up a command prompt and navigate to the .\source\container folder. Copy and paste the four commands given to you by AWS in order to update the image.
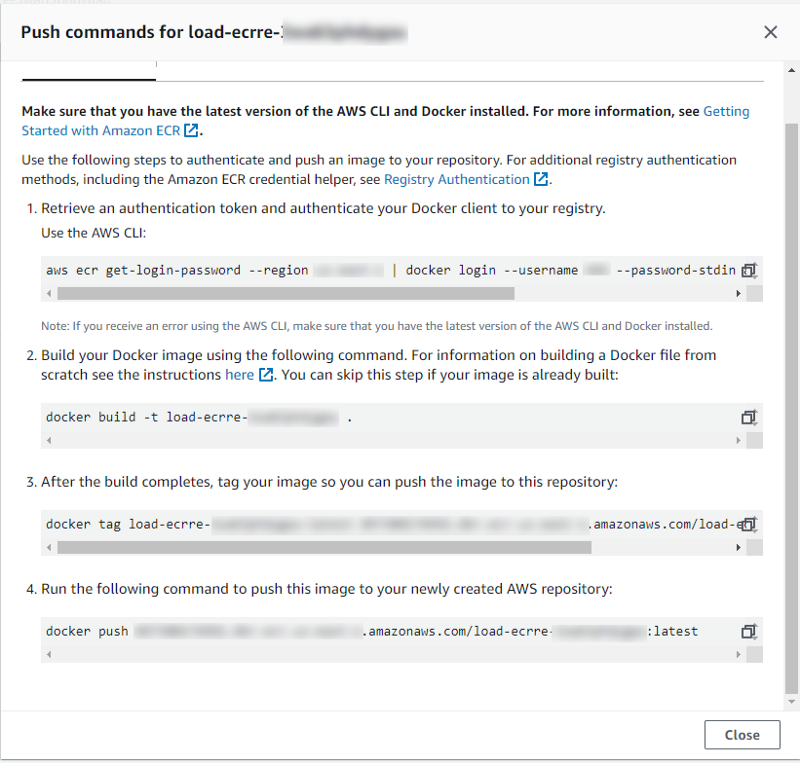 Note: If you need to make multiple changes to the image, be sure to add ‘— no-cache’ to the end of the command on step 2.
After the commands finish running, we’re ready to run the tests!
Running the Load Test
After the stack finished deploying, you should have gotten an email with a username, password, and link to the load testing dashboard. Go find that email, click on the console link, and sign in with the given credentials.
Hit the Create Test button at the top of the page to navigate to the load testing setup. Fill out the Name, Description, and Task Count fields with values you want for your test.
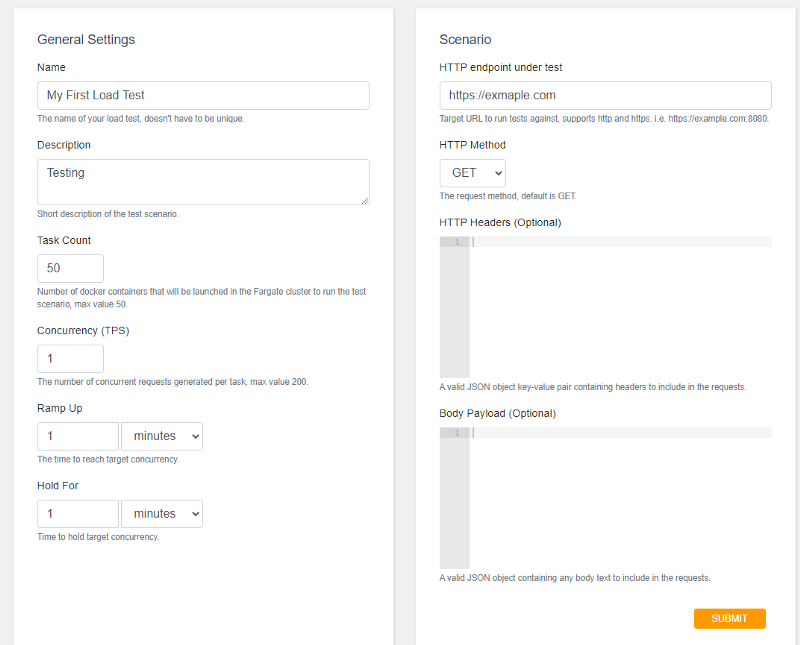
The changes we made to the Dockerfile and test.json have made the Concurrency, Ramp Up, Hold For, and HTTP endpoint under test fields useless, but they are still required in order to submit the form. Simply fill out the fields with any values you want — they will be ignored when you hit submit.
The Task Count field is going to spin up X amount of containers in your cluster to run your collection. Fargate has a limit of 100 containers running at a time, but this form has a limit of 50. If you wish to increase the throughput to 100, you can open up the browser dev tools and change the limit from 50 to 100.
When you hit the Submit button, it will spin up all the containers and start executing your Postman collection!
Monitoring
 Photo by Chris Nguyen on Unsplash
While the load test is running, you’re going to want to monitor the performance of your application. There are two areas we want to watch for with serverless apps:
- How the infrastructure scales
- How your code handles scaling
To do this, we can make two CloudWatch graphs to monitor in real-time.
Infrastructure Scaling
We want to take a look at API Gateway and Lambda functions across the board. If our app doesn’t handle load graciously, we will get throttling events and the app will become sluggish and non-responsive.
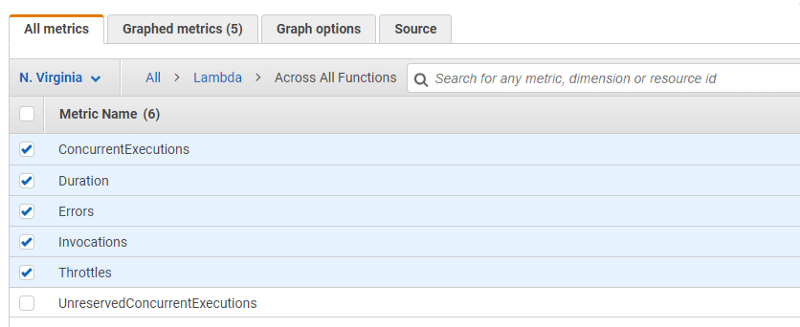
In Cloudwatch, navigate to the Metrics console. Click on Lambda metrics > Across All Functions. You want to enable ConcurrentExecutions, Durations, Errors, Invocations, and Throttles.
Next, we want to view the ApiGateway > Across All APIs > Count metric.
Click on the Graphed metrics tab and change the statistic type and period to match the image below.
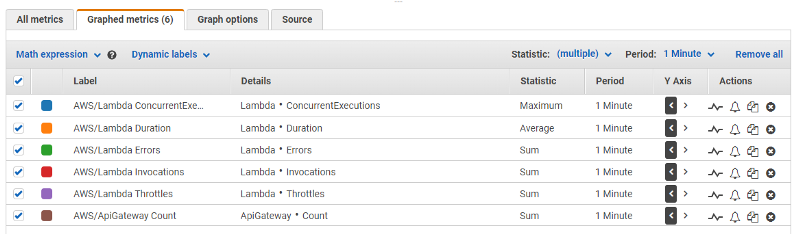
As far as infrastructure scaling goes, this is going to cover the majority of a serverless app. If you use other AWS services, feel free to add other metrics. The graph will update in real-time to show you values across all these stats.
Application Scaling
You also want to see if your app is throwing any errors during the test. Since the system is being exercised through API Gateway, we want to monitor the responses of our API messages.
In a new CloudWatch graph, you want to view the 4XXError and 5XXError metrics for all of your APIs. Click on ApiGateway > By Api Name > filter for 4xx and select all results.
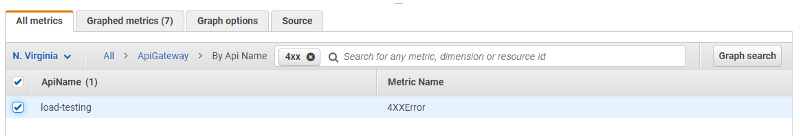
Remove the filter and do the same thing for 5XX.
If you run into any throttling issues with the AWS services your lambda functions are using, they are bound to turn up as a 400 or 500 response through your API.
These two graphs will show you the health of your serverless app as it scales through the load testing. If you see errors start to crop up, you can modify the graphs to show specific lambda functions and start digging into logs.
Conclusion
Load testing doesn’t have to be hard. You want to see if your application performs as seamlessly at scale as it does in a development environment.
Postman enables you to record and playback your business process through the browser. It is a one for one copy of what is going to be done in the field.
AWS enables you to scale that playback and hit your application with thousands of requests a minute. It also provides you a mechanism to view the health of your app as it scales to adjust to the workload.
To top it all off, when you’re done with the load testing, you have a pretty good understanding of how much your app is going to cost to run. As I’ve written about before, forecasting serverless costs can be difficult, but this can be regarded as a source of truth. Test the system with a production workload and view the cost breakdown via the AWS billing service.
Don’t skip load tests. When your app hits prime time, you need to know it’s going to perform. You’ve already made the right choice by choosing serverless to build your app. Let’s tie a bow on it and prove how well it performs at scale.
Have fun!


Share on:
Join the Ready, Set, Cloud Picks of the Week
Thank you for subscribing! Check your inbox to confirm.
View past issues. | Read the latest posts.